Free Gantt chart template for Google Sheets and Excel
Fill it in like a table: task, owner, start, end and progress. The bars draw themselves. Free, no sign-up, no add-on.
Download the template (.xlsx, 16 KB)
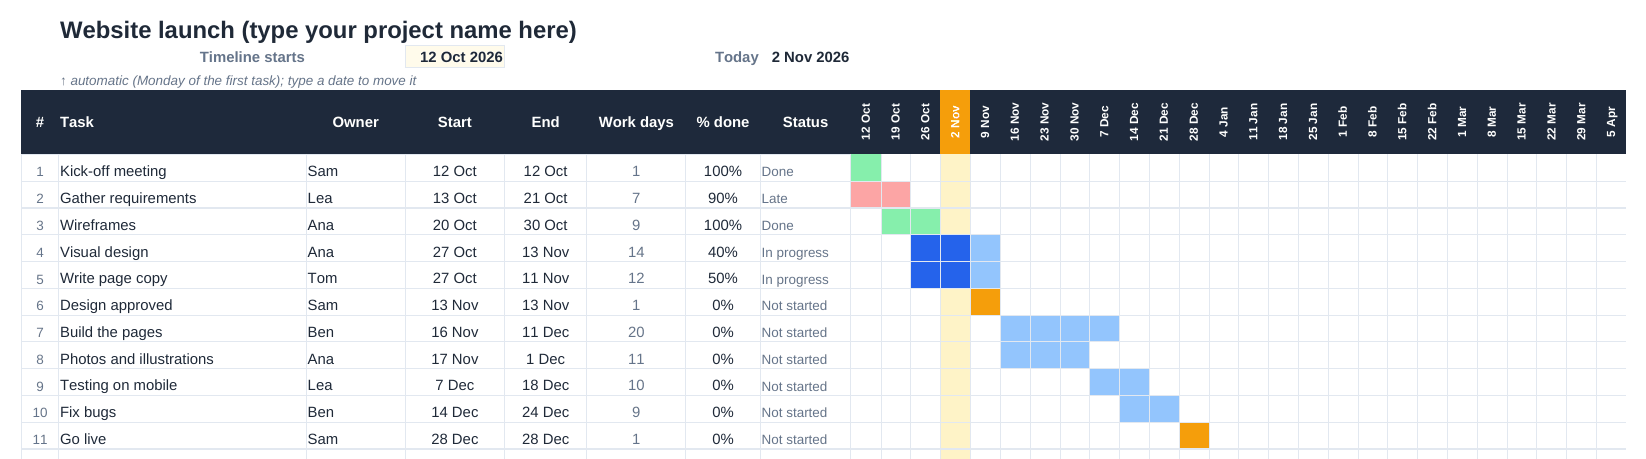
What it does
- One row per task: name, owner, start date, end date and % done, for up to 40 tasks.
- Bars by week over 26 weeks, from the Monday of your first task, or from a date you type.
- The darker part of a bar shows the progress. Finished tasks turn green, late ones red, and milestones (start = end) orange.
- The work days (Monday to Friday) and the status (Not started, In progress, Late, Done) are calculated for you.
- The current week is highlighted.
Open it in Google Sheets
- Upload the file to Google Drive (New › File upload).
- Open it, then choose File › Save as Google Sheets.
- Type over the example tasks. The How to use tab explains the rest.
In Excel, just open the file. It also works in LibreOffice Calc.
When a template is not enough
A template is a separate copy of your plan: when a date changes, you change it twice, in the sheet and in your calendar. If your tasks and meetings are already in Google Calendar or Google Tasks, CalGantt draws the same kind of chart from them, in Google Sheets or in your browser. Drag a bar and the event moves in Google Calendar; tick a task and it is done in Google Tasks. It also has dependencies, the critical path and a Kanban board.
Try CalGantt in your browser How it works
Questions
Is it really free? Yes. No account and no e-mail address. You may use it, copy it and share it.
Can I plan more than 40 tasks or 26 weeks? The template holds 40 tasks and shows 26 weeks at a time. To see other weeks, type another start date in the yellow cell at the top.
Does it change my Google Calendar? No. It is a plain spreadsheet, not connected to any calendar.